Gravity and pressure at permanent seafloor benchmarks.
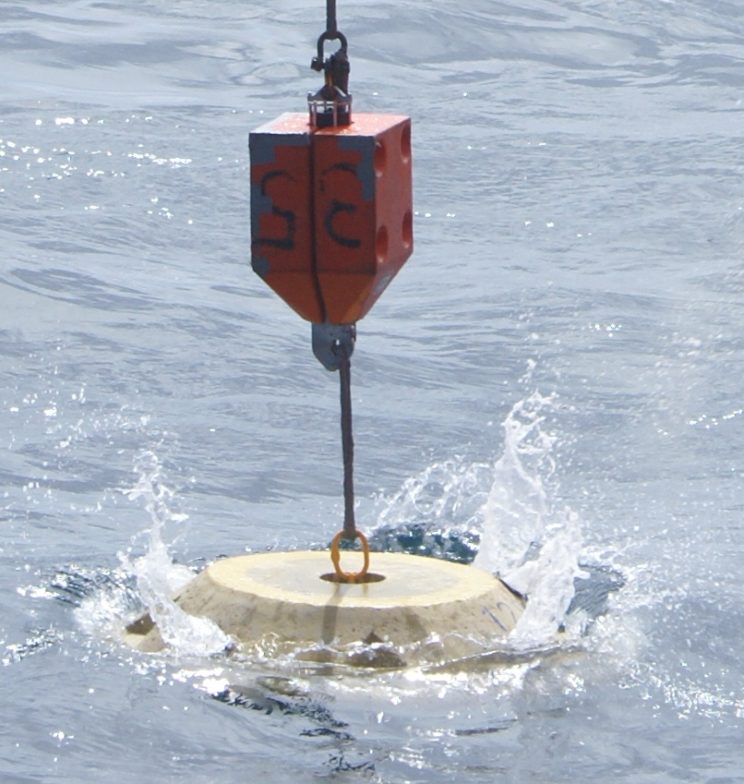
Benchmark cone in the splash zone.
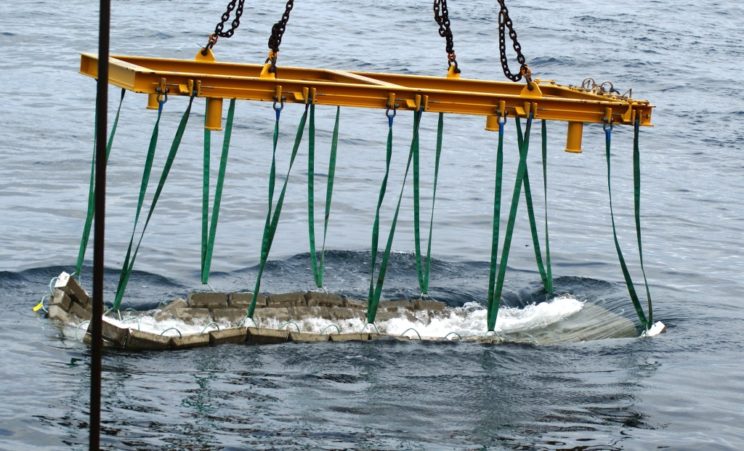
Mat in the splash zone during deployment.
Permanent seafloor benchmarks make sure measurements are at the same location in subsequent surveys. We have long experience in design, production and deployment of concrete platforms at the seafloor. The conical shape protect them from outer disturbance, e.g. by trawling. Benchmarks may need scouring protection in certain high-current environment. They should not be too heavy and have a relatively large bottom area such that excess pressure is small and likewise the settlement into the seafloor.
Deployment of benchmarks is ideally done months ahead of the first survey. While ROV-assisted deployment is safe and reliable, instrumented deployment without visual inspection has been safely and successfully done many times from much simpler and cheaper vessels.
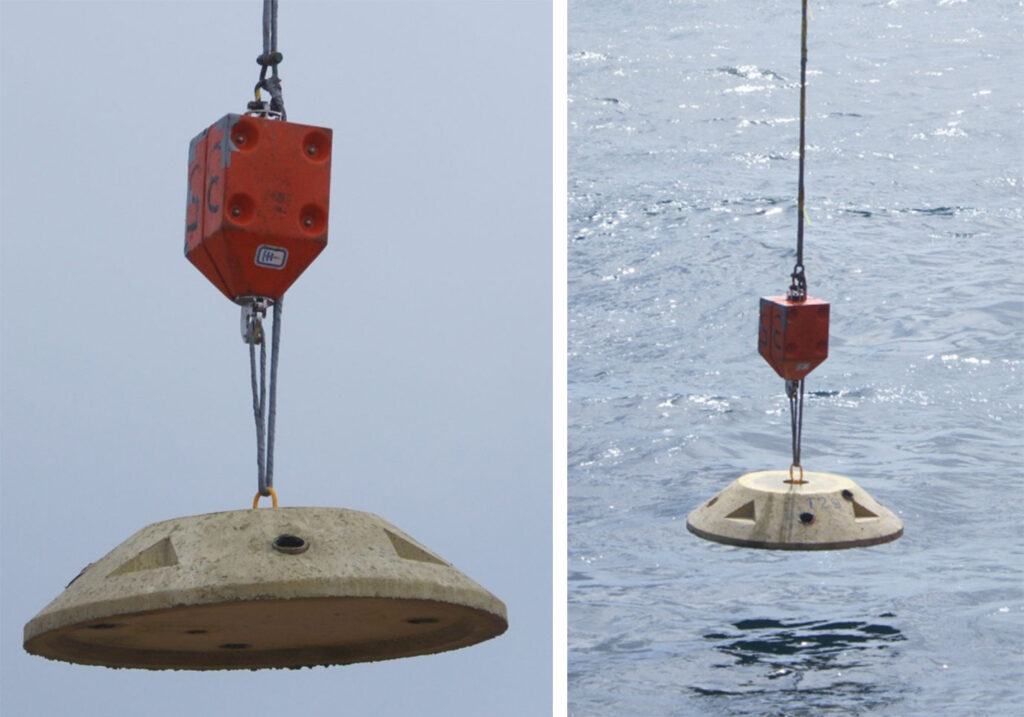
Benchmark cone and deployment of benchmark cone as infill station at the Troll field in 2012.
Surveys are carried out with an ROV and support vessel, which transport the instrument frame from station to station. Power to the ROVDOG and two-way communication is provided via the ROV and umbilical to the operator on-board the ship. The operators of the ROVDOG and the ROV sit ideally closely together to secure a smooth operation.
At the beginning of a survey, stand-alone reference pressure gauges are deployed at half a dozen stations distributed around the field. They are picked up again at the end of the survey. Reference pressures are downloaded from one or two of those stations during the survey, to provide data for the real-time quality control, as tidal models are not accurate enough for the mm resolution required.
Data are processed for Quality Control in two or three steps, using Attrack. The ROVDOG operator displays after each new measurement a composite plot of QC attributes, where irregularities in the time-series can be identified. In the offline QC, new measurements are subsequently fitted in a network solution including all data so far, being corrected for drift and providing estimates of station values. As a survey progress, the station values will become increasingly reliable and can be compared with previous surveys as time-lapse changes.
Our software Attrack can simulate surveys. This is useful for optimising the layout of stations as first part of a program, to optimise the positions and number of stand-alone reference pressure gauges in survey-planning and to decide on the sequence of measurements in a survey including the number of repeat stations.
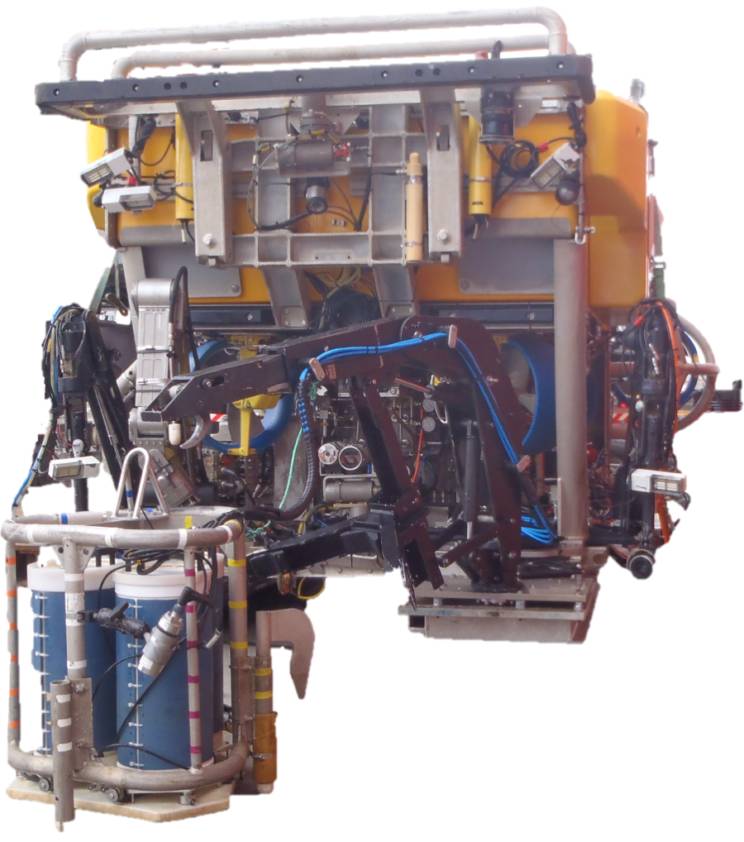
ROVDOG and ROV front.
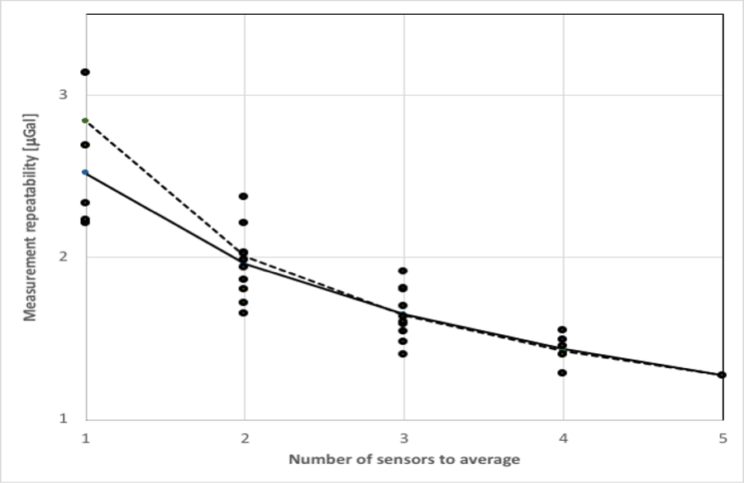
Measurement repeatability as function of the number of sensors in use for a North sea survey. From Eiken and Zumberge (2019).
The gravity precision obtained in a survey will depend among others on the type of gravity sensors, the number of sensors in the instrument frame, the number of visits to make at each station, the speed of operation (shorter time between measurements will reduce the residual drift), and the height precision. The latter will a.o. depend on the number of sensors to use in the instrument frame, the number and distribution of reference pressure gauges and oceanographic conditions during the survey.
The cost of a vessel with ROV capacity is usually the dominant survey cost. Experience has shown that their speed of operation can vary significantly. This is important to assess prior to deciding on a ship and a survey plan. We can assist in estimating the cost of this part of the operation, evaluate alternatives against each other and thereby help increase the data acquisition efficiency.
More measurements and more sensors improve precision, but how much and at what cost? To answer these questions, vessel day rate and operational speed of the ship and ROV will matter. With survey simulations we can estimate cost-quality curves.
Our 20′ workshop container and 10′ storage container are convenient for some survey mobilisations at remote places. Apart from these, the equipment can be shipped by air-freight anywhere in the world, as has been routinely done from California to Norway and back for the North Sea surveys.
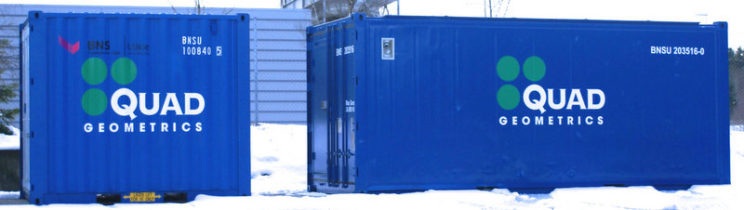
Quad Geometrics’ storage and workshop containers.