Gas & oil
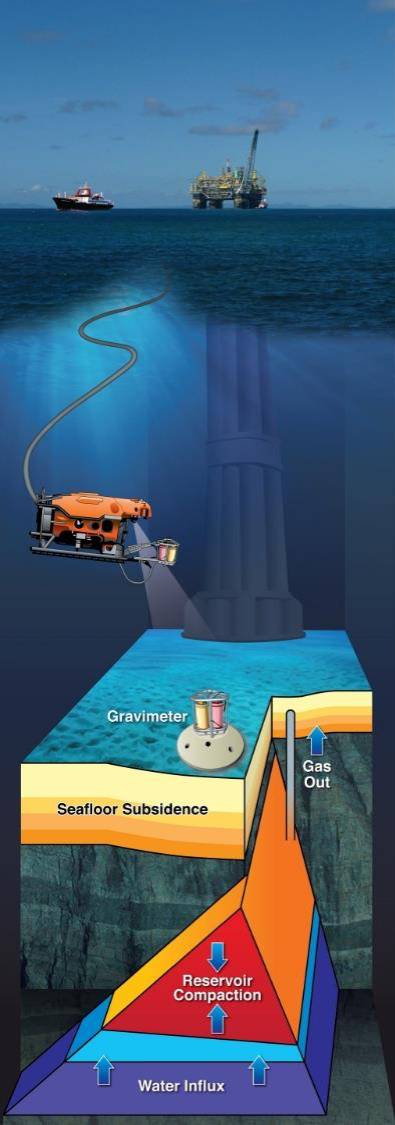
Gravity has been used successfully to monitor water influx in gas fields. Subsidence can give valuable reservoir information for both oil and gas fields.

Gravity surveys were carried out above the giant Groningen gas field in the Netherlands with some 20 stations in 1978, 1984 and 1996 (Gelderen et al., 1999). An extended grid of nearly 100 stations covering about 1000 km2 was surveyed by Quad Geometrics in 2015 (Eiken et al., 2017), with 1.1 μGal estimated station uncertainty . Results have been reported by Glegola et al., (2017).

Successive microgravity surveys over the gas cap of the Prudhoe Bay oil field from 2003 to 2008 provided insights into the distribution of water injected into the gas cap (Brady et al., 2008; Ferguson et al., 2008; Hare et al., 2008; Yin et al.,2016).
Gravity and subsidence monitoring has successfully been carried out over 10 producing hydrocarbon fields offshore Norway, some for 20 years. 9 of the projects are still ongoing.

List of fields with gravity and subsidence monotoring offshore Norway.
Map showing the location of fields with gravity.
Troll:
The giant Troll gas and oil field was the trigger for gravity monitoring in the North Sea. Gas production startet 1996 and is expected to continue beyond 2050. Gravity increase of up to several µGal/year from water influx and seafloor subsidence of up to about 1 cm/year from the reservoir pressure drop are both well seen (Stenvold et al., 2006, Eiken et al., 2008)

Subsidence map for the Troll field 2002-2005. From Stenvold et al., (2006).

Cross section of the Troll reservoir.
Mikkel:
Mikkel is a gas-condensate field with initially 23 billion Sm3 (1 TCF) gas. Vevatne et al., (2012) described results from gravity and subsidence surveys in 2006 and 2011. Intra-survey repeatabilities were about 2 μGal and 2 mm after 2-3 visits were made at each location during each survey. Subsidence of up to 2 cm was measured over 5 years, having a signal/noise ratio of 5-10. Gravity reduction of up to 4 μGal over the northern part of the reservoir (after subsidence correction) is caused by a stronger negative gas depletion signal than the positive water influx signal.
Data were history matched , as described in . A mis-match could either be due to wrong pressure depletion, or incorrect water influx in the model. On Mikkel all models are matched on well shut-in pressures, and good communication is expected throughout the reservoir. Hence, the mis-match circles in the figure are interpreted as showing water influx different from the model (Vevatne et al. 2012).
The results show the gravity monitoring feasible not only on large fields, but on a modest size gas field at medium depth.
 Changes in depth and gravity above the Mikkel field 2006-2011. The backdrop is model responses. The filled circles show mismatch between modelled and measured changes.
Data were history matched , as described in . A mis-match could either be due to wrong pressure depletion, or incorrect water influx in the model. On Mikkel all models are matched on well shut-in pressures, and good communication is expected throughout the reservoir. Hence, the mis-match circles in the figure are interpreted as showing water influx different from the model (Vevatne et al. 2012).
The results show the gravity monitoring feasible not only on large fields, but on a modest size gas field at medium depth.
Sleipner:
Sleipner East is a gas field at 2400 m depth. Partly above and partly aside of the gas reservoir has CO2 been injected into a thick and clean sandstone at 800-1100 m depth. Initially 30 seafloor stations, later increasing to 43, have monitored gravity changes caused by flow in both reservoirs; water influx into the hydrocarbon gas and supercritical CO2 pushing water away. Alnes et al., 2008 showed how depth, spatial positions and models can be used to separate the two signals. The latest surveys have been used to estimate CO2 dissolution rate in the formation water, a process which is not quantifiable by other types of data (well pressures, 4D seismic).


Orman Lange:
Ormen Lange is a gas field with approximately 400 billion Sm3 gas-in-place (Brain et al., 2019). Production started 2007, and the first trial gravity and subsidence surveys at the same time. Full-field surveys have been carried through every second year since 2012, providing crucial information on lateral connectivity, compressibility and water movement (Brain et al., 2019).
The first field-wide steam injection in a fractured carbonate field has been monitored by gravimetry (Glegola et al., 2015). From surveys in 2013, 2015 and 2016, estimated density reductions were from 12 kg/m3 to 29 kg/m3, with the largest change in the steam injection area (Al-Lazki et al., 2017).