We can perform a variety of tasks in Attrack, covering all aspects of the value chain.
Experience has shown that the final processed data can vary significantly depending on the choice of processing parameters and calibration values. Results may also vary from other software packages due to differences in the choice of algorithms and perhaps also in the implementation of similar algorithms. The ability to detect and reduce anomalous behavior in the records (time series) can also matter. Our experience is that processing variations often are as large as the estimated total error.
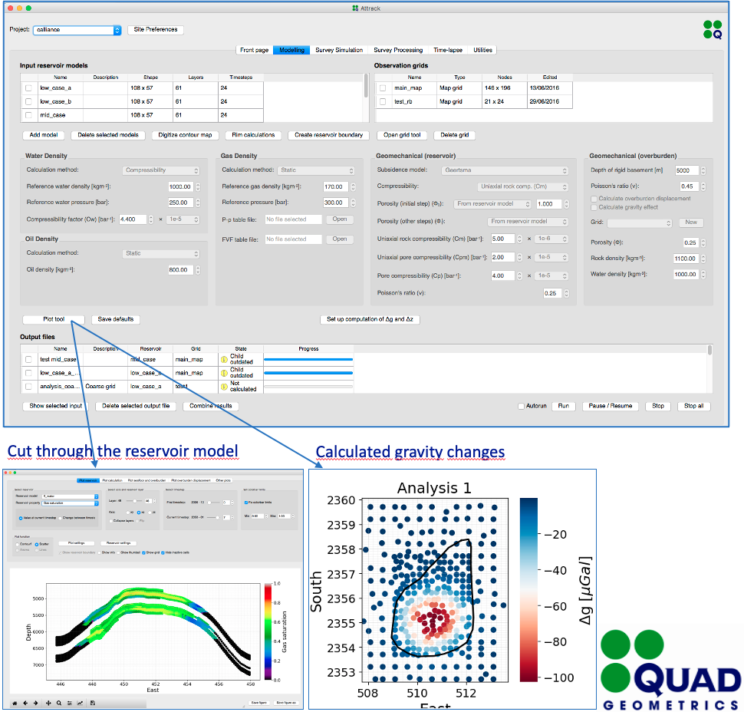
Modelling
From one or more models, surface gravity or gravity change, and height or height change, are calculated. A surface observation grid is defined prior to calculations. The gravity and height response from individual reservoir zones and from different fluid phases can be separated.
The input models, parameters and computations are managed through the user interface. The results can be displayed in map view or in cuts through the model. Results are written to an Attrack-internal file, which can be used for subsequent analysis.
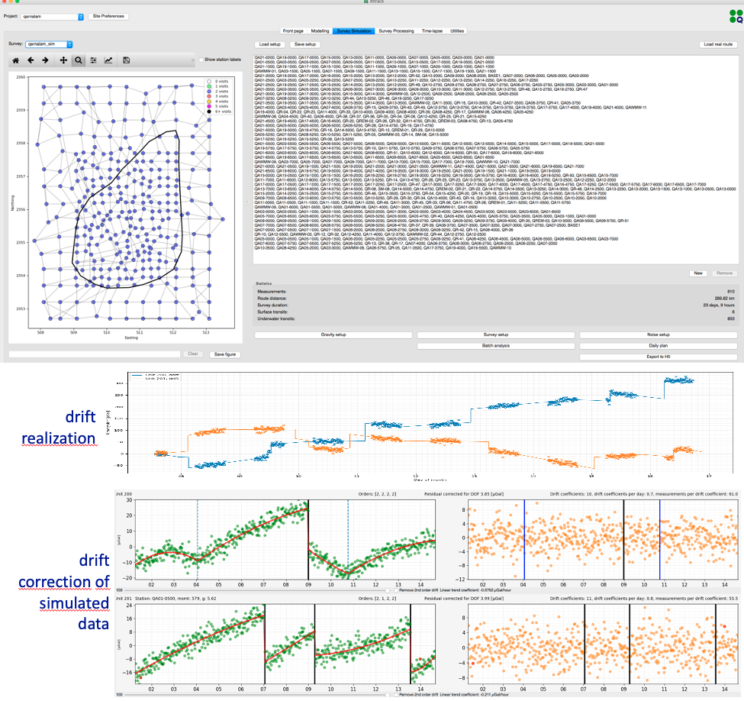
Survey simulation
A project’s stations are loaded and can be displayed in map view. A sequence of measurements is defined by clicking on stations on the map, or by importing an existing survey as a list of station names. Parameters for acquisition progress (speed of vessel/vehicle, speed of ROV, set-up time, measurement duration) are defined to calculate the calendar time of each measurement. Statistical noise parameters are set, with several options. Simulated gravity / depth data with a noise realisation is stored in an internal format for subsequent use in the processing module.
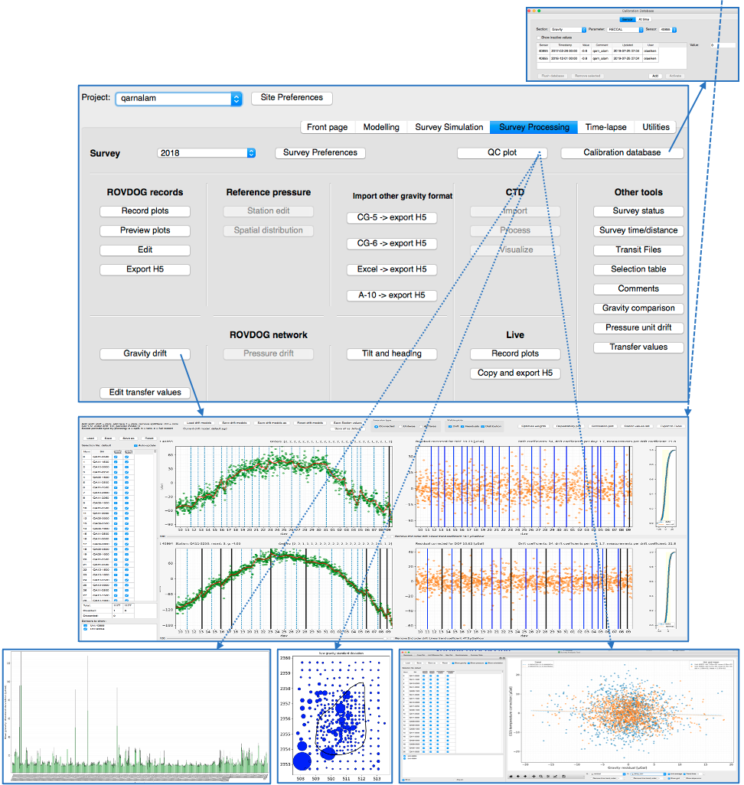
Survey processing
We can read a variety of formats in Attrack, and perform the full chain of data processing steps. All parameters of the processing flow are selected, stored and can be seen in the user interface. Many QC tools are available at various levels in the processing flow.
All standard gravity corrections, such as tilt, sensor temperature, tides and recovery are included. Several optional corrections are available as well. Model based solid earth tides and ocean loading tides are applied. Ocean tide corrections are either based on a model or recorded reference pressures. The latter is more accurate and applied when available.
The pressure data are corrected for ocean tide in the same way as gravity. Corrections for sensor position in a tilted frame and for sensor tilt sensitivity are made. A residual correction for temperature variations may be applied.
Drift corrections and station value estimates are made in a separate tool. This allows for a flexible definition of drift segments and their connections. Outliers can be identified in a residual plot and edited out from a table containing all records and measurements.
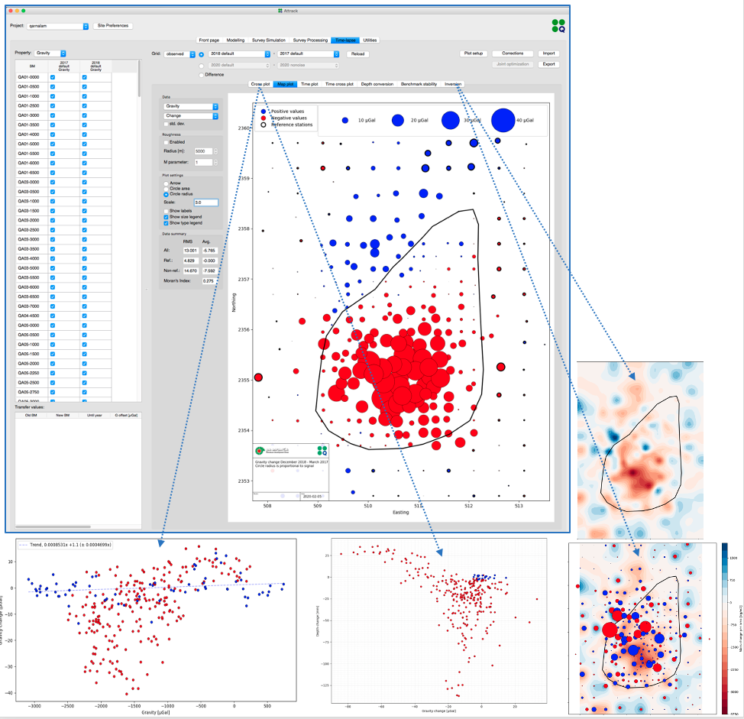
Time-lapse analysis
This module calculates and displays gravity or height changes between datasets, either real, modelled or simulated with noise. Values are displayed in the map either as circles or arrows. In the time-lapse module, the gravity data are corrected for height changes using a gravity/height gradient of choice. The zero-level is determined by one of several optional methods; the average of defined reference stations, the average of all stations corrected for a modelled signal, or manually. Several QC time-lapse cross-plots are available, and can be used to adjust scale factors. Statistical values of the data are calculated and displayed, like RMS level, Moran’s I and spatial correlation.