
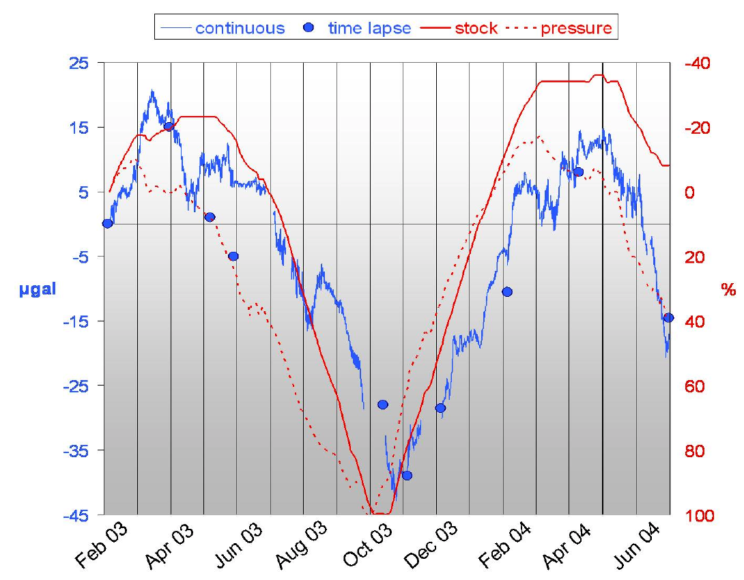
Diagram showing the timelapse gravity (blue dots), continuous gravity (blue trace), gas stock levels (red trace), and reservoir pressure (red dashed trace) at a monitoring well over a 16-month period (from Bate, 2005).
Hydrocarbon gas has been injected in the Izaute gas storage reservoir, France, during summer, and produced in the winter (Bate, 2005). Gravity measurements were made over a period exceeding a year, with one permanent gravimeter installed near the expected peak signal, as well as a grid that was surveyed once a month. The permanent station shows a clear seasonal gravity signal that correlated well with gas injection/production and pressure fluctuations. As the reservoir is depleted, the gas/water contact rises, resulting in an increase in the time-varying gravity field. In the figure, the polarity of the gravity data has been inverted to facilitate easier comparison.
The phase and density of injected CO2 in a storage reservoir will depend highly on temperature and pressure. The critical point at 31.1°C and 7.39 MPa makes a supercritical state most common for depths below 1 km. Both the injection temperature and geothermal gradient matters. An example of the size of a spherical CO2 plume and its gravity change for hydrostatic pressure, a geothermal gradient of 15oC + 27.5oC/km and water salinity of 3.5% is illustrated here. Injected CO2 is pressurized at the wellhead and gets further compressed down the well, which again will increase the temperature.
When CO2 pushes away water, saturation changes and consequently density and mass changes will be significant. Pressure increase will cause pores or fractures to expand and thereby create extra storage space. Both mechanisms cause mass changes and consequently gravity changes. Pressure will also cause deformations. Uplift can be used for controlling the injection of CO2 for storage, together with well pressures (e.g. Bohloli et al. 2018)
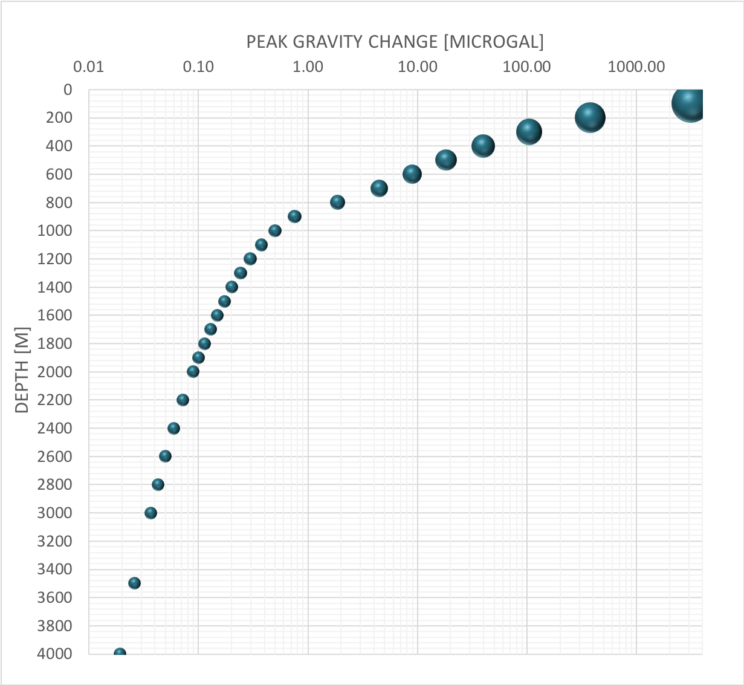
Peak gravity change for a spherical CO2 plume (bubble) replacing saline formation water at various depths. The relative size of the CO2 bubble is shown for each depth. From Eiken (2019).
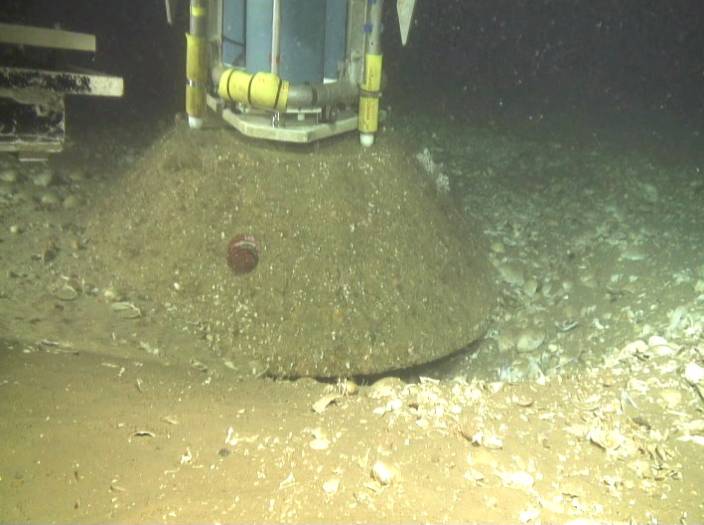
Photograph of one of the seafloor benchmark at Sleipner, in 2013, 11 years after deployment.
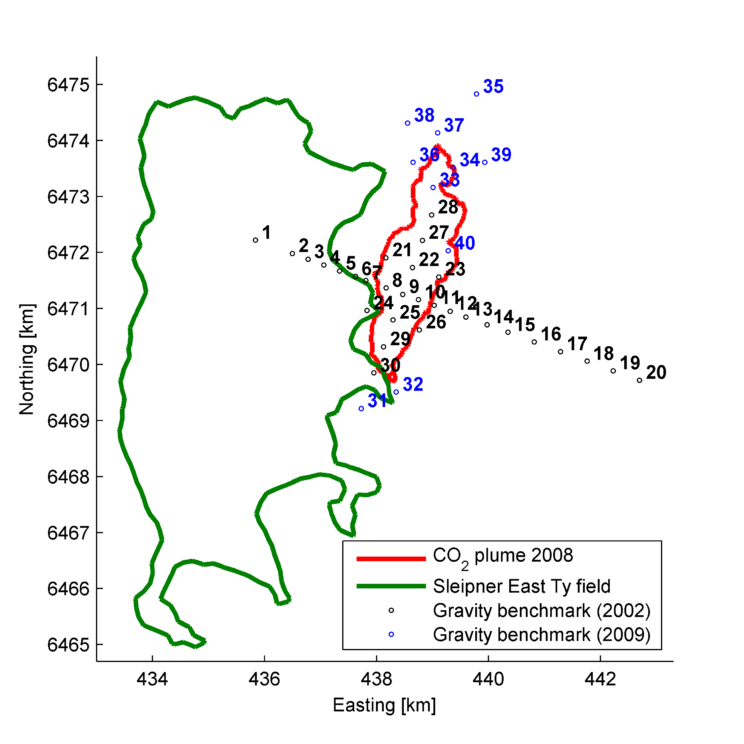
The layout of gravity stations, with the rim of the CO2 plume as of 2008 in red, and the rim of the Sleipner øst ty gas-condensate reservoir in green. (From Alnes et al., 2011).
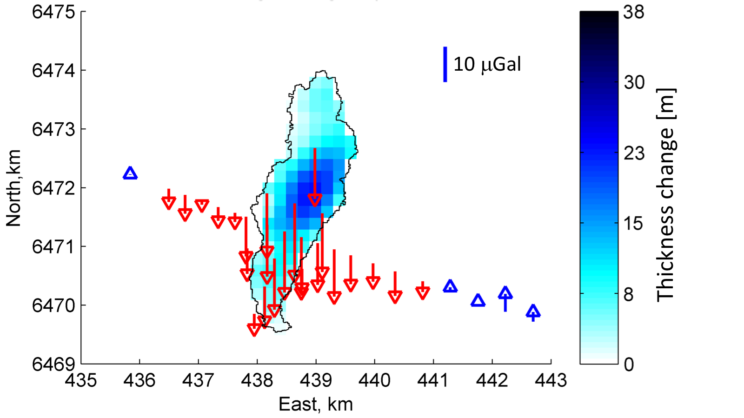
Estimated gravity changes caused by CO2 injection, from 2002 to 2013 (From Alnes 2015). Inverted CO2 thickness is shown as blue colors.
At the Sleipner CO2 storage site, Norwegian North Sea, seafloor microgravity surveys have been carried out by Quad Geometrics in 2002, 2005, 2009, and 2013. Nearly 1 Mtonne of CO2 has been injected yearly since 1996. The Utsira Fm. storage reservoir is situated 700–1000 m below the seafloor, at water depths of 82–83 m. Time-lapse seismic surveys have provided rich information on the outline and internal stratification of the CO2 plume. However, the seismic data are limited at quantifying CO2 saturations and resolving the vertical distribution of low- and high-saturation zones of CO2 at scales below the seismic wavelengths.
Benchmarks were distributed in a main profile plus some aerial coverage. Estimated station time-lapse accuracies are about 3 μGal (Alnes et al., 2011).
The seafloor benchmarks show relative height changes exceeding 20 cm between surveys. The benchmarks have likely been subject to scouring.
After correcting the gravity for height changes, using a vertical gravity gradient derived from the data, a time-lapse gravity increase of nearly 40 μGal was calculated at the westernmost station, gradually decreasing to no change over 2–3 km eastward. Alnes et al. (2008) explained this strong increase as caused by water inflow to the Ty Fm. gas reservoir, in agreement with later acquired saturation logs in a nearby well and with 4D seismic data. More detail are found here.
After corrections were made for both the time-lapse height changes and water flow into Ty Fm, a gravity reduction could be identified above the central part of the CO2 plume (Alnes et al., 2008, 2011, Alnes 2015). The estimated maximum gravity reduction increased from about 10 μGal over 2002–2005 to more than 20 μGal over the time interval 2002–2013. The gravity data have in various studies been used to invert for the average CO2 density, dissolution rate of CO2 in the brine and lately also the thickness of CO2. For such inversions, the geometry of the CO2 plume as imaged in 4D seismic data, and the injected amount of CO2, are further constraining the models.
Alnes et al. (2008) estimated the average CO2 density, in a joint inversion with (1) the gravity height gradient and (2) a scale factor for the Ty Fm gas reservoir flow model (to adjust the water influx), as free parameters. They estimated an average CO2 density of 760 kg/m3, corresponding to a temperature of 29°C at 870 m depth for pure CO2. Alnes et al. (2011) used the longer time span of 2002–2009 to estimate 720 ± 80 kg/m3. They used an additional constraint on rock temperature from a well producing water from the same formation about 10 km away
From this they estimated a dissolution rate of CO2 in the formation water between zero and 1.8% per year. Hauge and Kolbjørnsen (2015) performed a Bayesian analysis of the in situ CO2 density and dissolution, using the same 2002–2005–2009 data set, with the Ty Fm and height change effects removed. They arrived at similar conclusions. After the 2013 data were acquired, Alnes (2015) updated the dissolution estimate to <2.7 % per year, based on the longer 2002–2013 time span.
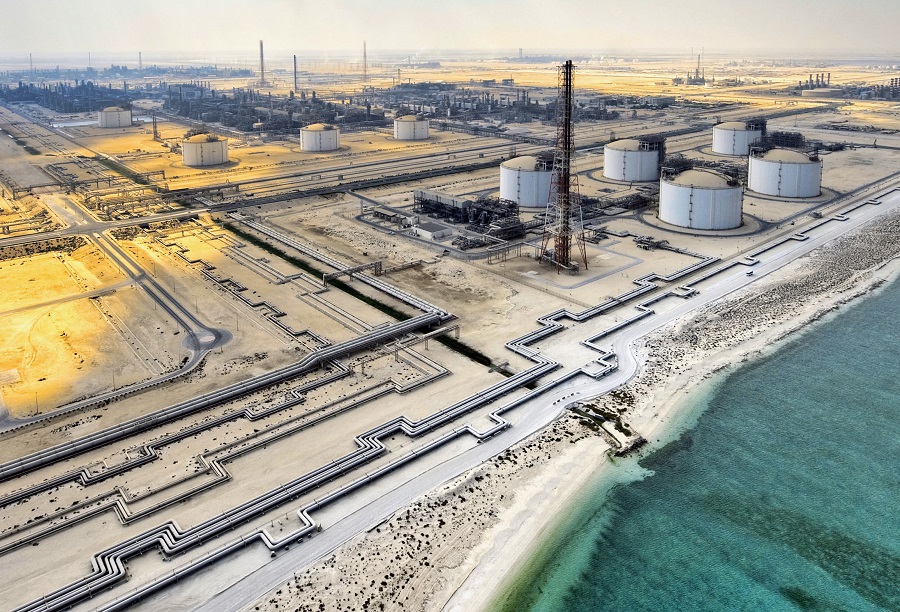
Gravity monitoring has been applied in a waste gas injection project in an industrial area near an LNG plant of Qatar (AhmadZamri et al. 2009). Five surveys were done in 2005 (2 surveys), 2007, 2008 and 2009 using A-10 absolute gravimeters on about 300 stations over a 50 km2 area. Challenges related to reconstructions caused 25% of the stations to be lost within 2 years. The anomaly from the gas injection was observed roughly as expected, in a circular manner.
Drill cuttings injection at the Veslefrikk field in the North Sea leaked to the seafloor. Produced water which was injected at the North Sea Tordis field caused leakage and a crater at the seafloor. Monitoring could have provided early warning on these events of fracturing to the seafloor, but was not done.
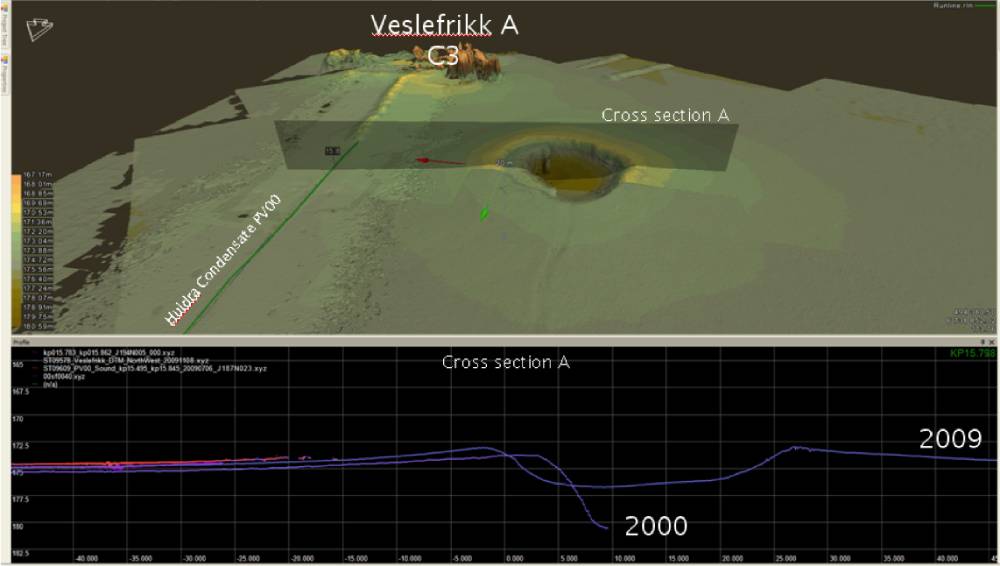
Difference in seafloor depth between year 2000 and 2009, with a 30 m wide and 10 m deep crater. Figure from Bellona.