Notice: Function _load_textdomain_just_in_time was called incorrectly. Translation loading for the rocket domain was triggered too early. This is usually an indicator for some code in the plugin or theme running too early. Translations should be loaded at the init action or later. Please see Debugging in WordPress for more information. (This message was added in version 6.7.0.) in /customers/e/d/c/cbqwokfrj/webroots/r576718/wp-includes/functions.php on line 6114 Support & acquisition QC - Quad Geometrics

Support & acquisition QC

We give consultancy and third-party advices during program and project planning, data acquisition and interpretation.
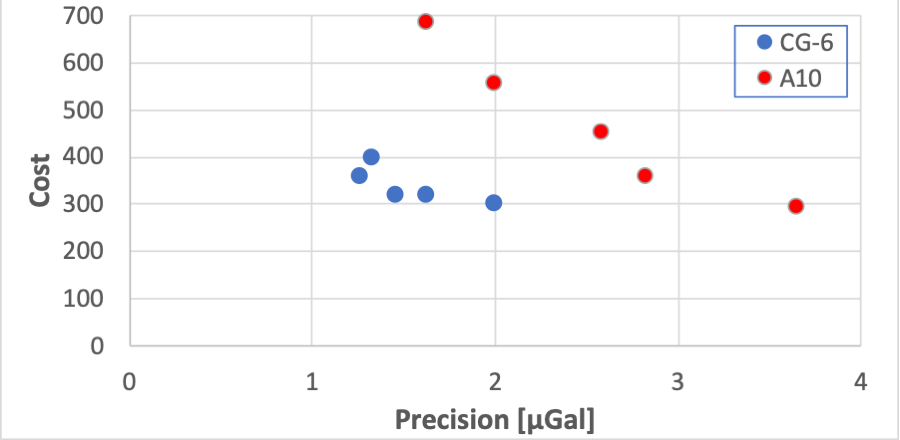
Picture shows model of noise reduction.

A simple model for noise reduction by redundancy converted into cost of equipment + cost of surveying, cross-plotted against estimated accuracy. From Eiken and Zumberge (2019).

Technical and administrative support

  • Preparing a time-lapse program with basis for decision on issues as:
    • Number of stations
    • Location of stations
    • Design of permanent benchmarks
    • Requirements for instrument packages in subsequent surveys
    • Cost-benefit analysis for all these front-end decisions
  • Preparing a survey plan within the project frame with issues as:
    • Survey optimization using the survey simulation tool
    • Choice of vessel / ROV
    • Choice of measurement duration at each station
    • Choice of number of repeat visits at each station
    • Choice of reference pressure sensors and their locations
    • Timing of a survey with respect to decisions to be made
    • Advice on the route to best data processing and analysis
  • Analysis of cost, quality, value and cost-benefit of the options

Data acquisition Quality Control

  • We can do daily QC (on-line) of third-party data acquisitions, as we do for our own surveys.
  • This will be based on work in our offices.
  • We download data either after each measurement or 1-2 times a day, dependent on customer requirements.
  • We use Attrack with its QC tools for the analysis.
  • For each record, we will check for deviant samples, trends across the time series and other irregularities.
  • We fit each new record average into the network solution, drift inversion and station value estimate and update for the whole dataset. Outliers are identified within the survey and time-lapse.
  • The client receives a daily report with QC plots, metrics, updated processed data and identification of needs for re-measurements.
 
Picture shows hand with a computer. The hand is check-boxing in the air

Contact us for onshore & offshore solutions

Get in touch with us