Gravity measures and its' changes
Hydrology
Gravity measures changes in the aquifers. It is useful for monitoring the sustainability of water supply and utilisation.

Precise gravity measurements can reveal changes in the amount of groundwater in the underground. For an infinitely wide layer of water (2-dimensional model), 5 cm thickness change corresponds to 2 µGal, regardless of depth. This is about the vertical resolution that can be obtained in a microgravity survey. The porosity and specific yield in the aquifer will modify the resolution, to for example a 25 cm change of the water-air contact, for a storage coefficient of 0.2.
In this way, depletion and recharge of an aquifer can be monitored. Gravity can be more robust than well measurements because of the larger volume of investigation (gravity responds roughly to an area with radius equal to the aquifer depth). Gravity measurements are non-invasive, without the permitting requirements or potential contamination issues of groundwater wells.
More than 100 papers have been published on gravity hydrological monitoring. Some examples are:
In Colorado, Gehman et al. (2009) investigated a 3 km² area with 145 gravity stations. Difference in gravity between times of no pumping and pumping were positive near the recharge ponds and negative near the pumping wells, with changes of up to 80 µGal. Data uncertainty was about 5 µGal, which gave high S/N ratios even if higher precision can be achieved today.
In the city of Albuquerque, New Mexico, a larger 100 km² area was covered with 35 gravity stations (Kennedy and Bell 2023). 13 surveys over 5 years showed aquifer drawdown in the central part which had not been captured by the more widely spaced wells. Based on the data, inflow seems to balance outflow when about 15 million cubic meters is pumped per year. Specific yield could be calculated.
In the Strengbach catchment in the French mountains, Chaffaut et al. (2022) reported 25 surveys of 16 gravity stations covering an area of one km2 over 28 months. A stationary gravimeter measured continuously at one location. The data were interpreted in terms of a hydrological model.
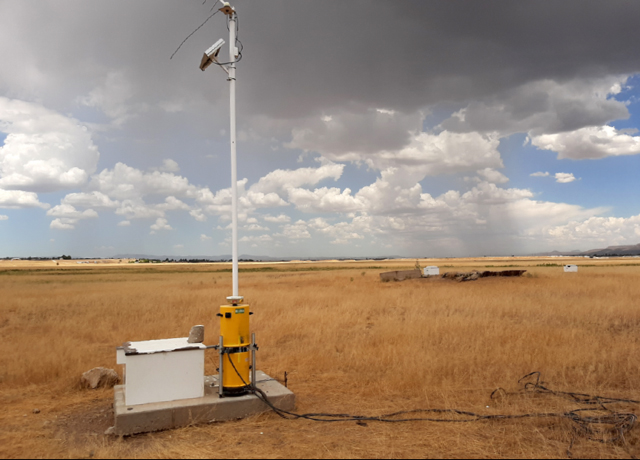
Photograph of an absolute gravity meter at a water monitoring well in Paulden, Arizona, USA. Photograph taken by Jeffrey R. Kennedy, U.S. Geological Survey.

Satellite measurements (GRACE and GRACE-FO) have high precision, but the lateral resolution is limited to a few hundred km’s. Such data can give a broad picture. Boergens et al. (2020) showed water deficit during the Central European drought in 2019: Clearly seen but lack of spatial resolution limits the practical use for a community or an enterprise.
It is a challenge to cover large areas with microgravity data in an economic way. The gravity grid may be matched to the spatial resolution of the model in use (Kennedy et al. 2021). One may want to fully cover the area of a catchment or a basin, weighted against the cost. For a given area, the cost will to the first order scale with the number of stations, or the inverse square of the station spacing, shown as the blue line in the figure. The value of information, on the other hand, may increase less with smaller station spacing, as indicated by the orange line. The most economic choice would be where the two curves are most separated.
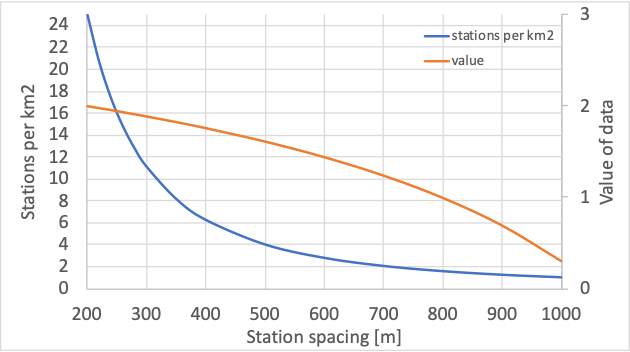
Example of station density (blue) and value of information (orange) as function of station spacing. The cost is roughly proportional with the blue curve.
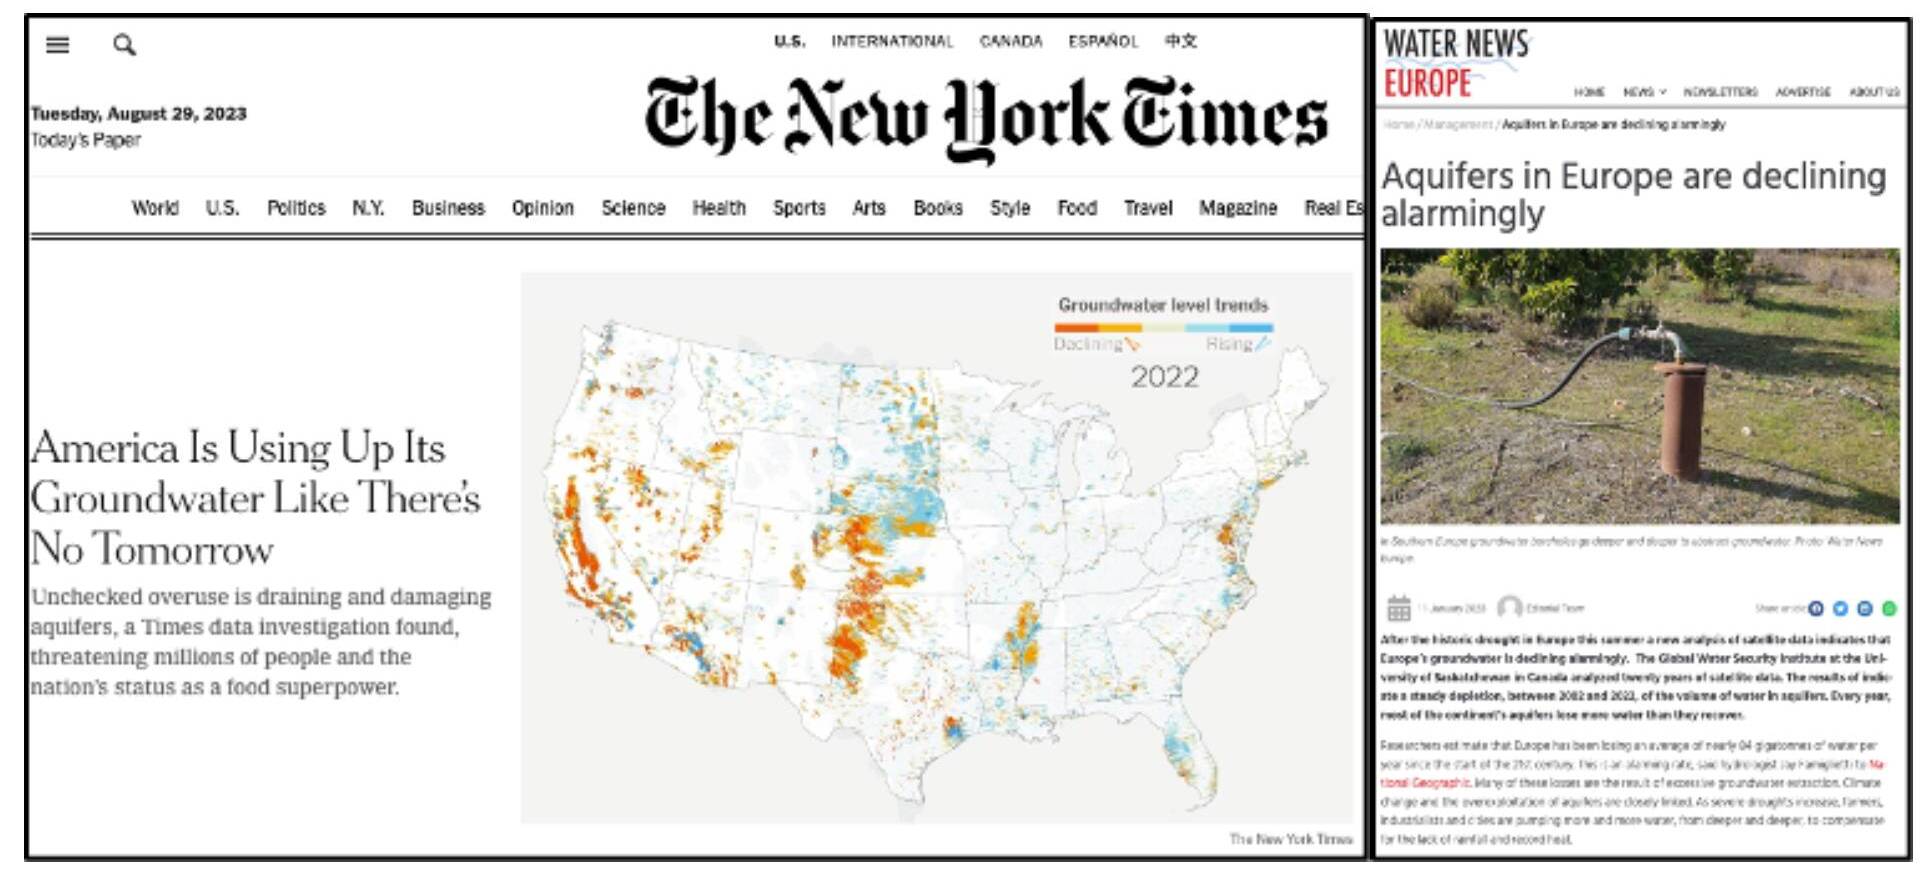
Front page of the New York Times 29th August 2023 showing a map of mostly lowering water level in US wells. Similar concerns are reported from Europe.
Gravity monitoring can with improved instrumentation, better processing and more efficient operations in the field be done more precise and less expensive than in the past. It has been a research subject and can now be moved into the hydrogeologist’s toolbox for more regular use in aquifer management.
Gravity monitoring of mass changes can play an important role in the effort to balance and regulate the use of aquifers – a need that becomes increasingly urgent (Figure). Surface gravity could provide similar information as wells, but volumetrically more precise and with better areal coverage. Hydrological information can be valuable in the large (and increasing) part of the world with scarce fresh-water resources.
Pumping of ground water is correlated with subsidence, as shown in an overview given by US Geological Survey. As much as 35 thousand square km is affected in the US. Subsidence caused by ground water extraction is a problem particularly in densely populated areas, such as Mexico City, Beijing, Jakarta and Venice (Tzampoglou et al. 2023). Monitoring elevation changes can also be used as a tool to estimate ground water changes, useful for example in areas of drought or aquifer over-exploitation (e.g. Murray and Lohman 2018).

Subsidence cause gravity changes at the surface, because of the vertical gravity gradient. In time-lapse gravity programs, height changes must therefore be measured and corrected for. This can on land be done by InSar satellite data, GPS or traditional optical levelling.
Offshore, subsidence of the seafloor can be measured to a precision of 3 mm or better using water pressure and reference stations either outside the area of subsidence or having absolute height references. Quad Geometrics offer such technology, which can be used in stand-alone pressure instruments or together with gravity sensors. As many of the subsidence areas are close to the coastline – and can change the coastline – it is of value to observe subsidence also in the offshore part of a subsidence bowl for understanding the cause and make predictions.