Notice: Function _load_textdomain_just_in_time was called incorrectly. Translation loading for the rocket domain was triggered too early. This is usually an indicator for some code in the plugin or theme running too early. Translations should be loaded at the init action or later. Please see Debugging in WordPress for more information. (This message was added in version 6.7.0.) in /customers/e/d/c/cbqwokfrj/webroots/r576718/wp-includes/functions.php on line 6114 Processed data & analysis report - Quad Geometrics

Raw & processed data for gravity & height measurements

Data and reports

Raw and processed data represent the basic value of gravity and height measurements. Data products of different types and formats are delivered, as listed here below. Reports describe data acquisition, processing and analysis, representing the refined knowledge and value derived from the data.
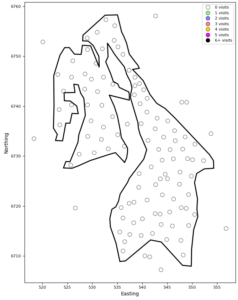
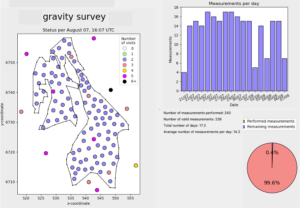
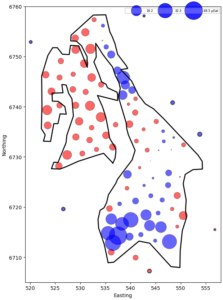
Picture shows raw and processed data services.

Raw & processed data

  • Station x,y positions based on GNSS and (offshore) underwater acoustic navigation. Offshore, this is usually provided by the ship and ROV operator.
  • Precise depth based on GNSS, InSar or traditional land surveying (onshore) or water pressure (offshore)
  • x,y,z-data are usually provided for all stations in an Excel spreadsheet.


  • Gravity as output by the sensors. For Scintrex CG-5 or CG-6 this is gravity, tilt and temperature at 10 Hz or 6 Hz sampling. For absolute gravity it may be an average number.
  • Sensor tilt
  • Sensor temperature
  • Date and time
  • Station name – to connect with position
  • Metadata, dependent on type of measurement and survey
  • Calibration constants, from most recent calibrations
  • Pressure proxy, for instance frequency output for Paroscientific Digiquartz sensors
  • Sensor temperature
  • Sensor tilt
  • Date and time
  • Station name – to connect with position
  • Pressure proxy, for instance frequency output for Paroscientific Digiquartz
  • Sensor temperature
  • Sensor tilt
  • Date and time
  • Station name – to connect with position
  • From CTD probes, either launched from a ship crane or attached to the ROV:
  • Water temperature T(x,y,z,t)
  • Salinity s(x,y,z,t)


  • Wave height (estimated from a weather buoy, a nearby oil platform, the ship movements or a shore station)
  • Air temperature
  • Wind (average and maximum speed, direction)
  • Rainfall (onshore)
  • Sunshine
  • Position of ship, ROV, car or instrument vs. survey time
  • Duration of instrument set-up and de-rigging at a site
  • Duration of measurements


  • Best estimate of station values of gravity
  • Uncertainty of gravity values, with spatial dependencies
  • Best estimate of station values of depth
  • Uncertainty of depth values, with spatial dependencies

Project Reports

Final reports from a project shall describe the work in a transparent way, such that processed data and their uncertainties can be well understood. Usually the report contain chapters on:

  • Equipment
  • Data acquisition
  • Calibrations
  • Benchmark status
  • Reference pressures (offshore)
  • ROVDOG pressures (offshore)
  • Estimated (relative) station pressures (offshore)
  • Pressure-to-depth conversion and time-lapse height analysis (offshore)
  • Gravity data processing
  • Estimated (relative) station gravity
  • Time-lapse gravity changes
  • Quality control and identification of noise level and noise characteristics
  • Analysis of time-lapse signals

Contact us for onshore & offshore solutions

Get in touch with us